
International Award-Winning
Seagull Web App
Making life-saving data discoverable and engaging for the scientists who don’t have time to deal with messy interfaces
-
How might we create an innovative database for water scientists and Great Lakes users that pulls data from real-time platform reporting, forecasted model data, and archival data.
-
Since this was uncharted water (pun intended), our MVP goals were simply to capture early adapters such as scientists and researchers. From there, the client would seek federal grants to further build and connect Seagull to global databases.
Additionally, our experience goal was to keep the UI simple. Gathering momentum happens when a variety of users can learn the system and recognize its value immediately.
-
I was the Lead UX & UI Designer throughout the entire project. When the VP of Experience went on leave, I absorbed her responsibilities of leading the product vision and roadmap. I worked in tandem with project managers, a team of full-stack developers, and client stakeholders.

Discover & Define
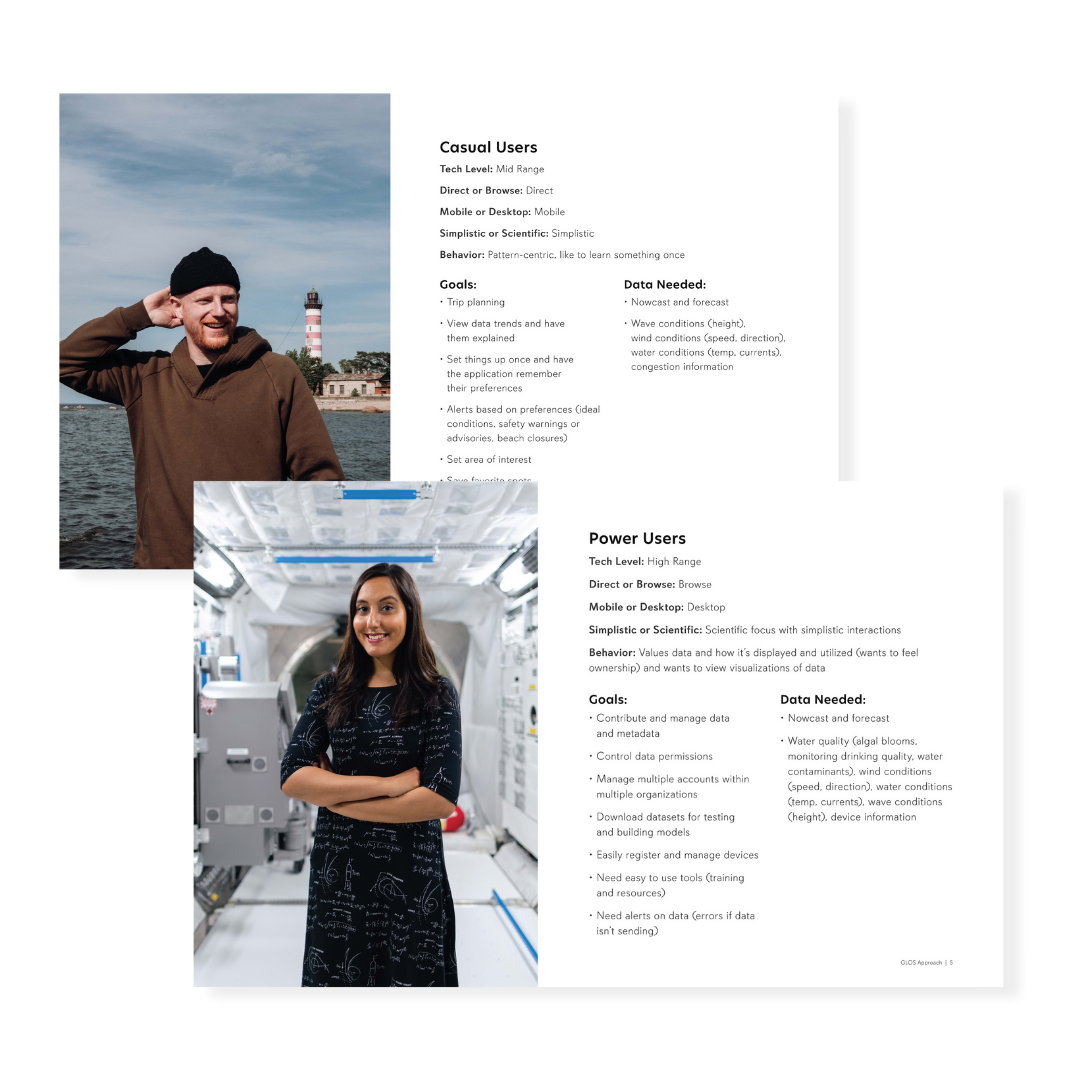
With a lot of exciting and competing ideas, we needed to gather focus quickly to ensure we built the right thing. Dozens of hours in workshops to learn the water data world and its challenges, and dozens more hours prioritizing those challenges into an MVP strategy.
Workshops • User Interviews • Personas • User Flows • Product Roadmap

Understanding the existing product, ERDDAP, and its shortcomings was imperative as we learned how to get in the minds of water scientists. ERDDAP had extremely powerful data processing APIs, but the information architecture was a nightmare. The good news was that we could take what ERDDAP had already solved for and enhance off of that.


Design & Deliver
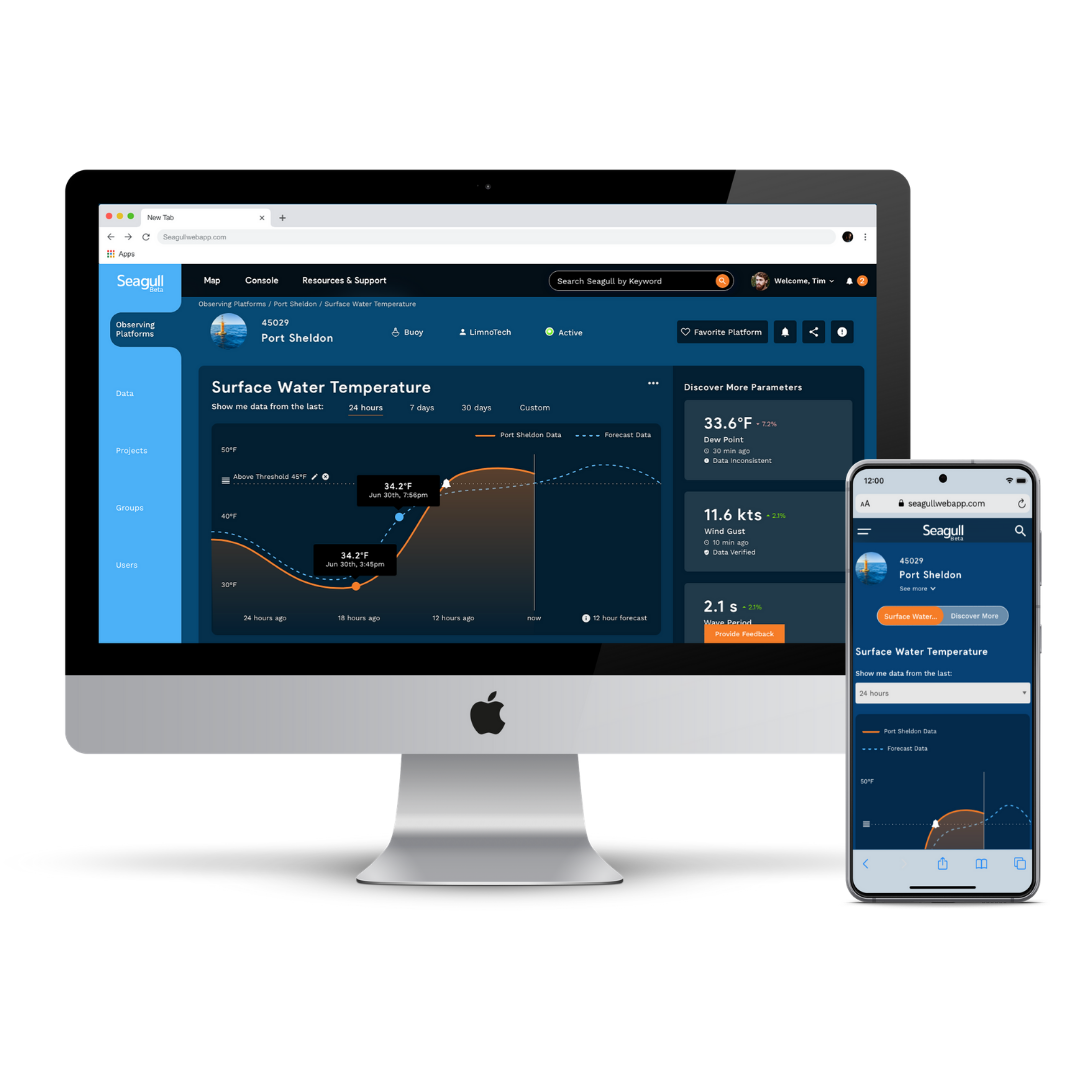
A functioning prototype that felt like the real thing was created so it could be tested with real users. It needed to strike the balance of sophisticated data platform and accessible “even my grandma could use it” simplicity— not an easy thread to weave. Special attention was paid to the micro interactions with the map and the data visualizations.
Wireframe • Prototype • Usability Testing • Design System


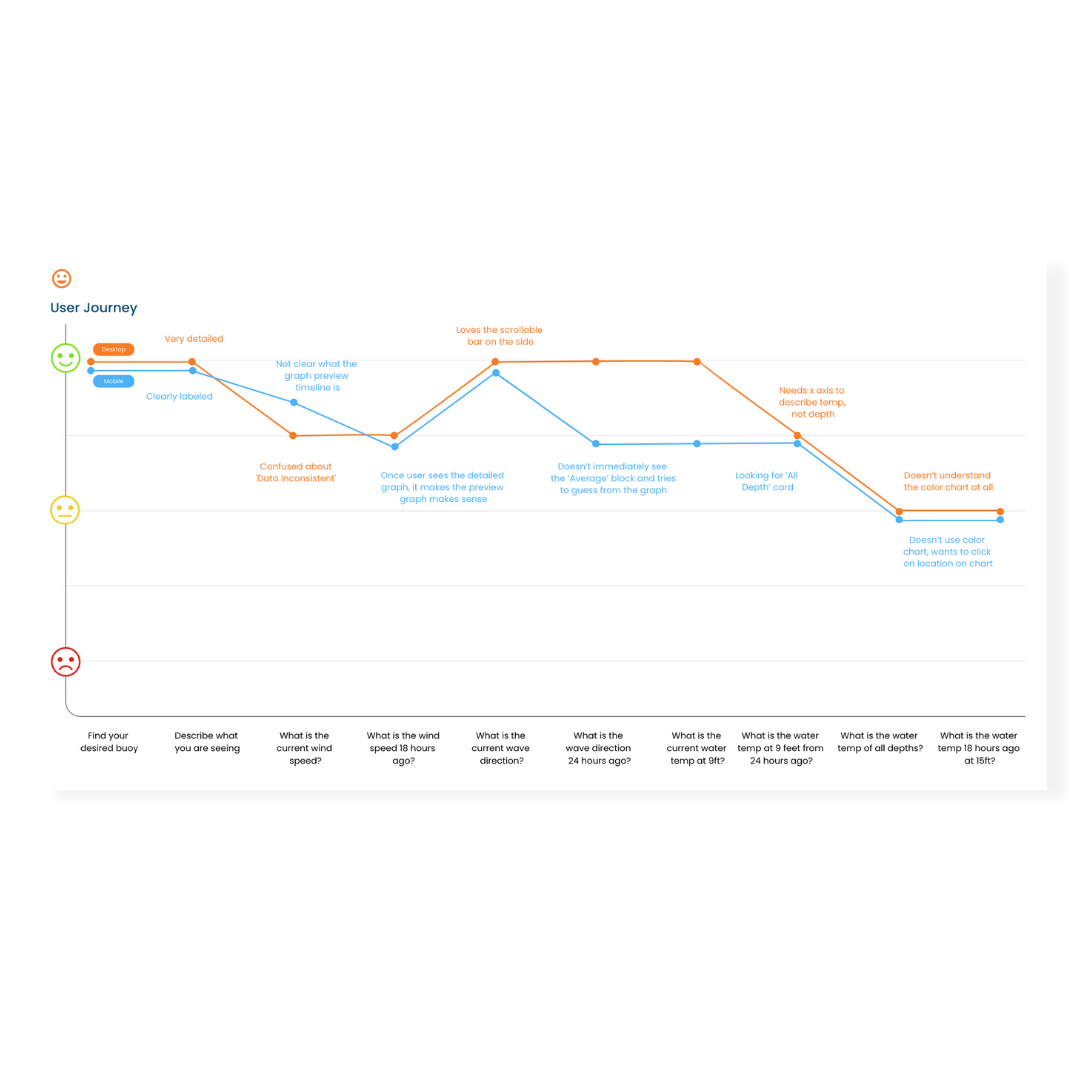
The aggregated data from a series of unmoderated usability tests where users were asked to perform tasks in the prototype. Users had difficulty understanding data visualizations on mobile, so we adjusted the designs accordingly.


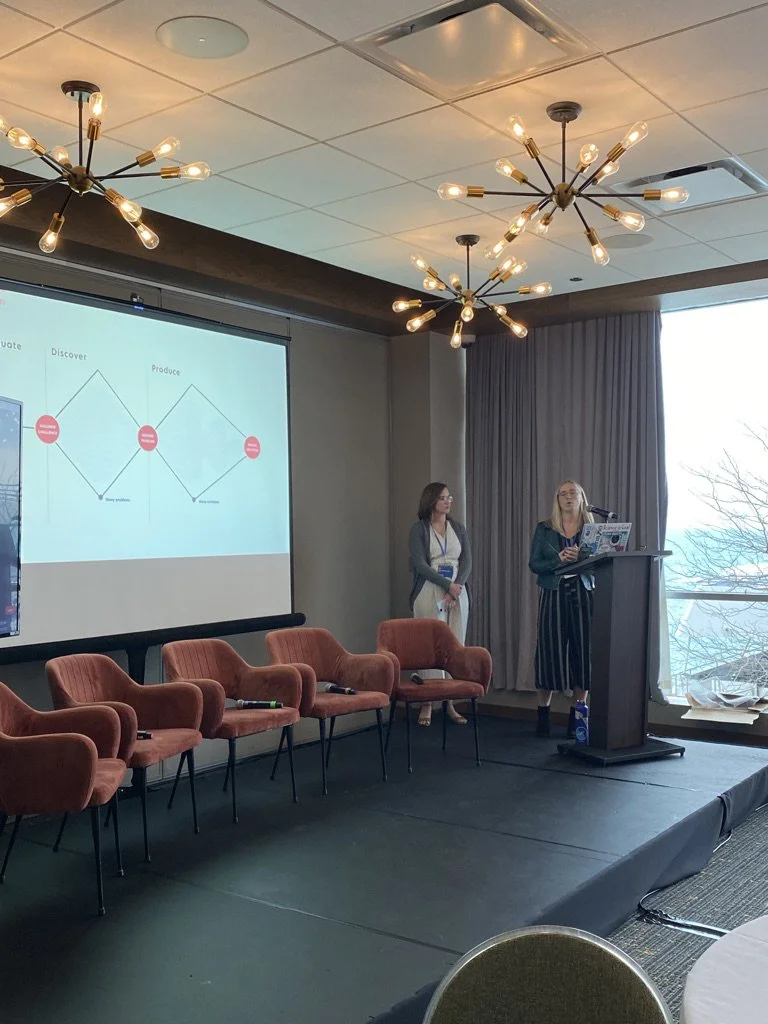
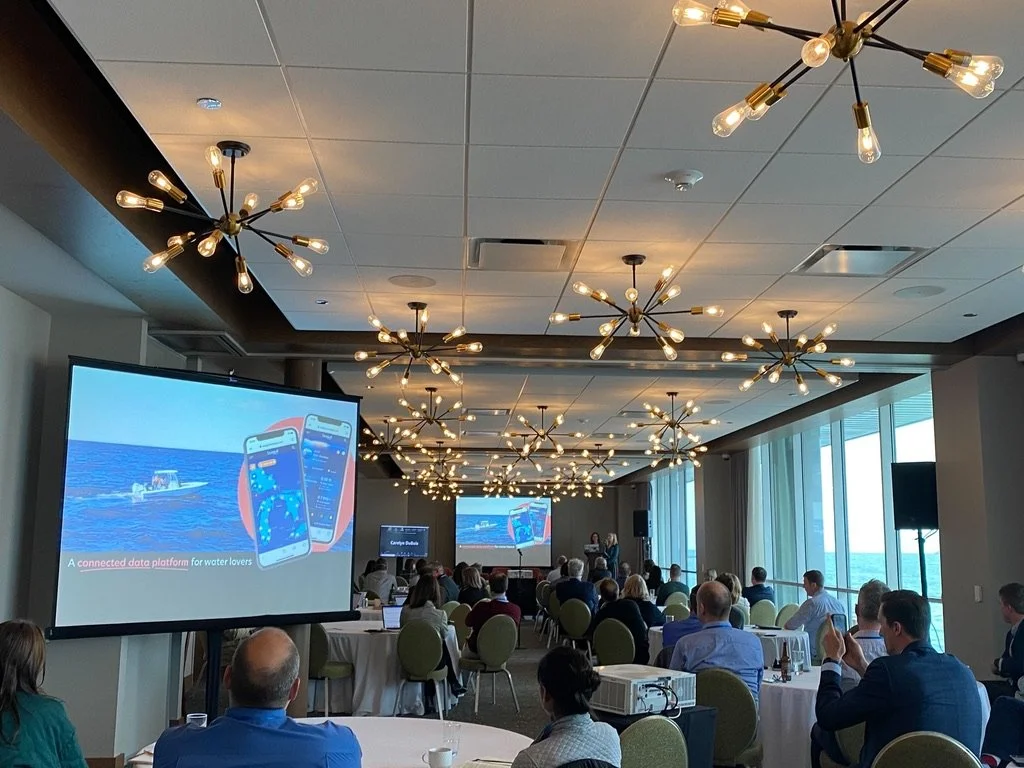
I had the immense privilege to speak on the impact of Seagull at GLOS’ Annual Meeting in April 2022 in Chicago. In attendance were members of NOAA and IOOS, both organizations who have tremendous interest in embracing digital collaboration.
Final Impact
Since its launch in April 2022, Seagull has soared high. It is bringing together organizations who have never been able to collaborate due to lack of data access. It has catapulted the digital transformation of the industry and invigorated new research. Seagull has even caught the eye of federal grants for preservation efforts. International organizations are paying attention and hoping to collaborate with the new technologies being championed by the Great Lakes and Seagull.
Bonus!
Here’s an infographic to better explain all the complexities and capabilities behind Seagull.
